 © 2010 Google Earth
 © 2010 Google Earth
Flying wildly around the earth and swooping at will into the cavernous depths of the Grand Canyon or along the dizzying edges of the Swiss Alps is a favorite past time of mine. Virtual globes such as Google Earth permit this infinitely enjoyable activity but surely must serve a more meaningful purpose than allowing me to visit the isolated beaches of Socotra, Yemen, when I should be working. So just what is their intended purpose? You may have heard that they’re for “geo-visualization” but what, then, is the deeper meaning of that?
Geovisualization is an emerging field that draws upon approaches from several disciplines such as cartography, information and scientific visualization, and geographic information systems (GIS) to provide theories, tools, and methods for the presentation of geographic—or spatial—data. In some cases this may mean creating data with coordinates from global positioning systems (GPS) and then using the established methods and tools to display them in print or digital form.
In other cases it may mean teasing out the geographic—or spatial—component of data that already exist, such as statistics about countries, cities, or administrative units, to allow them to be displayed on a map or in some other form that highlights spatial relationships. These relationships, in turn, can give us new insights into problems that we are trying to solve. Spatial thinking moves beyond askingwhere to asking why.
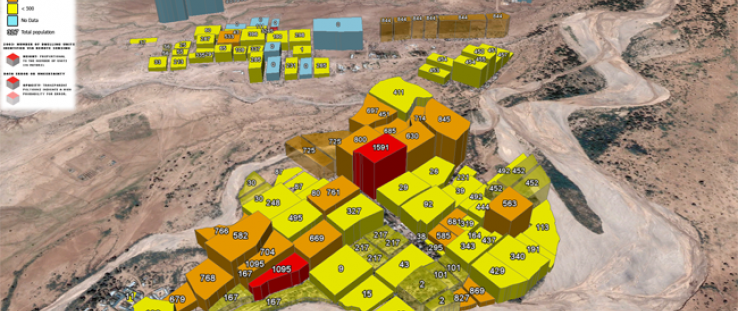
An example of the latter would be a geovisualization that I created for population data in Kakuma refugee camp, Kenya. I was investigating the relationship between demography and landscape change and had come by two data sets. The first was population estimates for portions of the camp as captured by a refugee registration database. The second was estimated locations, derived from satellite imagery, for all dwelling units, or shelters, in the camp. When the two datasets were combined and displayed in Google Earth, the resulting geovisualization allowed me to see some interesting relationships.
In some parts of the camp there was harmony between the two data sets: satellite imagery showed the greatest number of dwelling units in those portions of the camp with the highest reported population density. In other areas, however, radically different numbers of people were reported for adjacent sections of the camp showing the same number of units. This is useful information if, for example, you need accurate population data to calculate baseline health statistics.
The geovisualization revealed that the population data for the camp were more stable in some places than in others. And this question—why here and not there?—is the basis for the field of geography. Investigating the social process behind the why is another part of finding out why some places are different than others.
The geovisualization I created for Kakuma could not fully explain the harmony or discord seen in the data. However, it could show where I needed to investigate further. Taken in sum, this process of identifying and seeking to explain such phenomena is what we mean by “thinking spatially.” It’s about using the properties of location and space as a vehicle for structuring problems, finding answers, and suggesting solutions.
It Starts with the Brain
Development is, inherently, a place-based activity: It takes into account the differences between places. We work in specific places for specific reasons. Our programs have spatial, or geographic, impact. The effects of a school, a road, or a well are meant to radiate beyond the physical object itself to affect humans and the spaces they inhabit.
By thinking spatially we can analyze socio-economic, demographic, health, education, agricultural, or environmental data to highlight spatial and temporal trends that are difficult or impossible to detect on spreadsheets or in official reports. By thinking spatially about our current and future strategies, programs and projects, we can increase our ability to target at-risk or neglected populations. And the presentation and communication of these observations can be enhanced and easily comprehended using geovisualization.
It’s important to remember that thinking spatially doesn’t require a computer, GIS skills, or even Google Earth. While all of these things can facilitate the process, thinking spatially starts with the brain. Noting the location of a stakeholders meeting or where people are traveling from to get there does not require technical tools, nor does wondering why a program works better in one area than another.
USAID can already boast some good examples of spatial thinking. It can be seen in projects such as the Famine Early Warning Systems Network—a data analysis system that looks at multiple aspects of food availability and affordability in Africa; and in a small number of missions and the Bureau for Democracy, Conflict and Humanitarian Assistance where there are dedicated GIS staff.
Increasingly, missions and bureaus say they are interested in geographic thinking and geospatial tools. Specifically, nearly half of USAID’s missions have requested support for developing their own GIS centers. To this end, USAID is in the process of establishing a geospatial center that will serve as the focal point for the Agency on matters concerning geospatial information technology. This center will be used to implement mission-based Geo-MIS—a hybrid integration of geospatial analysis and management information systems—to do spatial analysis, map visualization, GIS training, and, generally, to build the Agency’s geospatial capacity.
By helping Washington and field staff “think spatially,” we expect to improve the overall planning, monitoring, evaluation, and communication of our development programs. Ultimately, we intend to make USAID an international leader in the application of geospatial information technologies for development.
Shadrock Roberts is a senior GIS analyst with USAID.
GIS Mission Examples
Several USAID missions are currently using geospatial data to better make decisions, design programs, and deliver assistance. Following are some concrete examples.
Identifying Temporary Housing in Haiti
PROBLEM: During a crisis or natural disaster, how does a mission and the Agency quickly and efficiently collect data to generate information used in urgent decision-making?
RESPONSE: In the immediate aftermath of the January 2010 earthquake, a wide range of federal agencies in Haiti collected geospatial data—including details on land slope and drainage; ownership patterns and use; road networks; and geological fault lines. The only way that the entire breadth of data could be practically managed was by incorporating it into a geographic information system (GIS). The result was a series of maps that showed areas where Port-au-Prince residents made homeless by the earthquake could be temporarily relocated.
Mapping Results and Impacts in Morocco
PROBLEM: How can a mission effectively monitor and evaluate the impact of a program or project?
RESPONSE: Over the past year and a half, USAID/Morocco has been building its geospatial capabilities to better collect data, and design and monitor its development projects. The mission’s long-term goal of building a GIS resulted in the launch of the Activity Tracking and Mapping System (ATMS) in June 2011.
After the events tied to the “Arab Spring” and the promise of constitutional reform in Morocco, it is more important than ever to understand where and how USAID projects are affecting local governance and civil society. The ATMS serves an important role in tracking the mission’s impact by quickly and clearly creating maps and tables of the locations and results of program activities. For instance, the ATMS will show where civil society and local governance programs focus their trainings and workshops while also keeping track of the number of participants at each event. To further assist program managers, the ATMS database tracks information at several different levels, the most specific of which is the commune level (equivalent of a county in Morocco). As a result, the ATMS will provide program managers in Morocco with information on citizens’ confidence in their local governments, and provide a useful monitoring system for tracking the progress made by civil society organizations in developing their advocacy capacity.
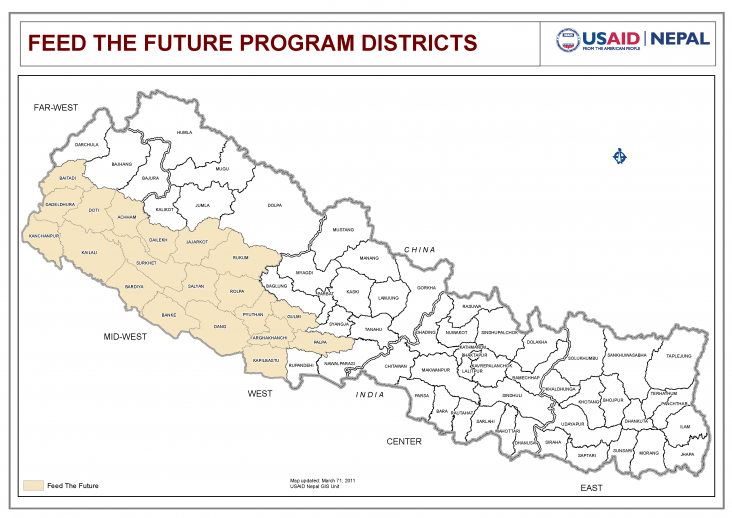
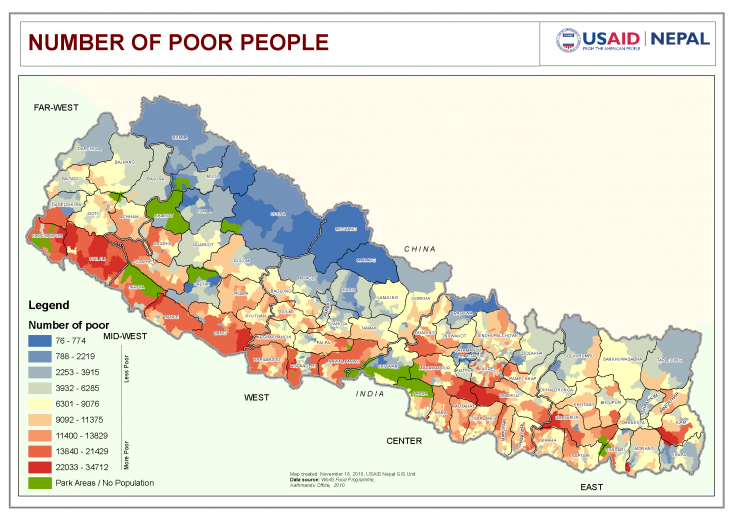
Designing Food Security Programs in Nepal
PROBLEM: Given limited resources, how does a mission strategically prioritize resources and program-planning?
RESPONSE: To ensure strategic decisions for determining focus areas of Feed the Future (FTF) programming, USAID/Nepal’s GIS unit designed and prepared a comprehensive set of spatial information products, categorized under themes ranging from biophysical to health to markets to socioeconomic. The team made this geospatial knowledge base available to the mission before the actual program design began. This spatial analysis helped in understanding the challenges of the country and in building spatial cognitive strength amongst the members. USAID/Nepal now has a more focused FTF strategy. This has enabled the mission to factor climatic resources, markets, and malnutrition information into its strategic decision making.



Comment
Make a general inquiry or suggest an improvement.