Innovation. Disruption. Revolution. These are the types of words we often use to describe transformative changes in a sector or market.
Today, the significant shift in the amount and types of financial resources flowing into developing countries is hardly newsworthy. In fact, it’s one of the frequently cited headline statistics at development conferences these days. In the 1960s, aid from the member countries of the Organization for Economic Cooperation and Development’s (OECD) Development Assistance Committee represented a majority of the total financial flows into developing countries. By some recent estimations, this figure now stands at just 7 percent.1
This decrease in the relative share of aid is all the more significant because absolute totals continue to grow. Preliminary figures for 2013 show a 6.1-percent annual increase in official development assistance to its highest level ever, $138.1 billion.
Yet the question remains: Has this shift in overall financial flows been—and will it be—revolutionary and disruptive in accelerating progress to end extreme poverty? How must the aid enterprise adapt in order to maximize the impact of these resources for the world’s poorest people?
Understanding the landscape
Private resources by far comprise the majority of dollars now flowing into developing countries from external sources. Overall, aggregate foreign direct investment (FDI) is more than triple overall remittances sent from family members and more than double official development assistance (ODA). Private philanthropy and other forms of charitable donations are also accelerating in growth and nearing the scale of government aid.
At the same time, there has been a far more dramatic increase in the scale of domestic resources in developing countries. In absolute amounts, the total has increased from $1.5 trillion in 2000 to more than $7 trillion in 2011.2 Developing countries not only have access to more of the world’s capital—as well as additional types of capital and financing mechanisms—they also have more of their own resources to match.
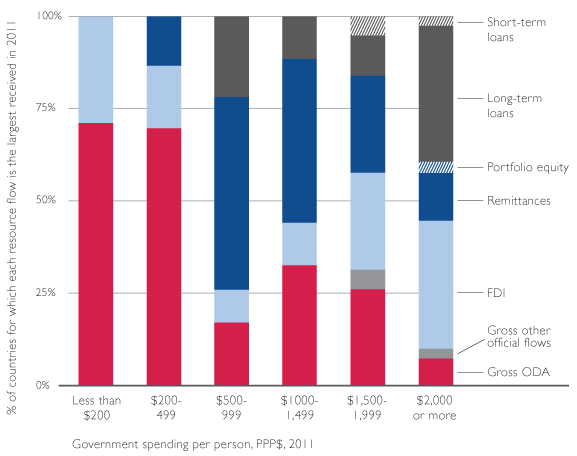
This is good news. Countries are responsible for their own economic and social development, and the mobilization of domestic resources lies at the core of this mission. As a country develops, its mix of external funding sources diversifies, with short- and long-term loans and portfolio equity
matching the scale of foreign direct investment and significantly outpacing remittances and development assistance (Figure 1). The combined scale of external investment and increased domestic resources offers great promise for stimulating the inclusive and broad-based economic growth that historically has been the surest path to reducing extreme poverty.
However, deeper analysis of external resource flows paints a more complicated picture. Africa remains the least-favored destination for foreign private flows and accounts for only about $50 billion out of an overall $1.35 trillion—a mere 3.7 percent.3 Yet in 2010, 34.5 percent of the world’s extremely poor live in sub-Saharan Africa4—a share expected to rise to 42 percent by 2015.5
External capital flowing to developing countries is heavily concentrated in 10 middle-income nations.6 In fact, an average of 70 percent of all combined public and private finance to developing countries from 2001-2010 went to these top 10; by 2010, net capital inflows had increased by an average of almost 80 percent, compared to an increase of only 44 percent for all other developing countries.
Brazil, Russia, India and China—the BRICs—are major recipients of FDI, with receipts tripling over the past decade. Their share of overall foreign direct investment keeps rising, from 6 percent in 2000 to 20 percent in 2012, and as a group they account for almost 40 percent of the FDI into developing countries.7 These nations are also coming into their own as private investors. Their outgoing foreign direct investment now makes up 9 percent of worldwide flows, up from 1 percent 10 years ago. While the aid community focuses on development cooperation with the BRICs and other South/South providers, limited attention is being paid to leveraging private investment from these countries for development purposes.8
While a majority of the world’s extremely poor now live in middle-income countries, several analyses show that this share will substantially decrease over the next 15 years due to continued economic growth and productivity that will attract ever-increasing amounts of external investment. Their need for development assistance will diminish as these nations obtain adequate domestic resources for their own development. As countries make this transition, aid will still be important for facilitating more sophisticated financing arrangements, crowding in other resources and helping ensure that marginalized and vulnerable populations also benefit from this growth.
By contrast, official development assistance still comprises more than 70 percent of the financial flows into least-developed countries. These countries are among the least able to finance their own development. Official development assistance also plays a primary role in fragile states, which have weak governance, are in conflict or are just emerging from conflict. These are among the world’s riskiest places for investment.
A majority of the extremely poor will likely live in fragile states by 2015, and as the extremely poor become increasingly concentrated in fragile states, it is likely that development assistance will as well. To successfully end extreme poverty in these difficult environments, we will need to increase the impact of this aid, as well as use it to crowd in and leverage other resources.
The United States is responding to this array of challenges. Our strategies in middle-income countries like India and Indonesia use aid for the following purposes: to support government investments in research and innovation, to strengthen the policy environment for private investment, to increase access to capital, and to ensure services for and inclusion of the poorest as economic activity and government resources continue to grow.
Since the commitment we made at the 2005 Gleneagles G-8 Summit, the portion of U.S. official development assistance to low-income countries has more than doubled, growing from 17.7 percent in 2005 to 39.6 percent in 2012. We achieved our Gleneagles commitment to double aid to sub-Saharan Africa a year ahead of schedule, increasing it from $4.34 billion in 2004 to $9 billion in 2009. That growth has been maintained, reaching $12.2 billion in 2012.
But this sells the story short. We are acutely aware that, for every dollar of official U.S. aid spent in 2010, developing countries received $3 in remittances from migrants living in the United States, $5 in U.S. private capital flows and $1 in U.S. private philanthropy.9 As developmental progress has brought us breathtakingly close to ending fundamental human indignities such as extreme poverty, hunger and preventable child deaths, success will depend upon our ability, and the ability of developing countries, to mobilize and optimize this full mix of resources—especially private investment. Therefore, the United States has increasingly focused on using aid to catalyze and leverage resources from the private sector and local governments while strengthening local systems.
A new type of partnership
USAID has been a leader in forging partnerships with the private sector for development impact. Over the past 12 years, the Agency has created over 1,500 public-private partnerships through its Global Development Alliance model, engaging more than 3,500 partners and leveraging more than $20 billion in public and private funds. But the scale of impact needed to achieve our post- 2015 ambitions, and the opportunity offered by the explosive increase in private investment, has provided an impetus for newer, larger partnership platforms.
The New Alliance for Food Security and Nutrition is a good example. The New Alliance was launched at the 2012 G-8 Summit at Camp David with a goal of bringing 50 million people out of poverty over 10 years. It matches the political leadership and policy reforms of African governments with the financial assistance and technical expertise of major donors to encourage private investment that benefits smallholder farmers. The New Alliance currently includes 10 African governments and a collective commitment by African and international companies to $8 billion in agricultural investments, with $1.1 billion invested to date. These investments already have created nearly 37,000 jobs and together with the Grow Africa partnership have reached more than 3 million smallholder farmers.
This partnership demonstrates that public and private investments are best viewed as complements rather than substitutes. Development cooperation through the New Alliance is enabling countries to follow through on commitments to policy reforms and institutional strengthening and improve their ability to attract private investment. However, different modes of private financing have different purposes, and it’s important to keep in mind that types and amounts of capital available for development, while growing, are not fungible. For example, we wouldn’t expect public external investment to finance the sort of investments normally undertaken by the private sector.
Power Africa, launched by President Obama in 2013 to bring energy to 20 million people, brings this into sharp relief. The initiative takes a transactional approach to identifying why particular transactions might derail and to piecing together solutions that draw upon different modes of U.S. Government financing, including USAID grants and technical assistance, Overseas Private Investment Corporation and Development Credit Authority loans and loan guarantees, and Export- Import Bank financing. This approach is achieving early success in unlocking private investment at scale, as private sector partners have agreed to over $14 billion in commitments so far.
Recognition of these modes’ comparative advantages and opportunities is leading to innovations, new sets of tools and new financing approaches. Impact investing, for example, is growing dramatically—the Monitor Group estimates that it could mobilize $500 billion annually within 10 years—and generally targets regions and sectors not addressed by traditional foreign direct investment. USAID’s Development Credit Authority, which uses partial risk guarantees to mobilize local financing in developing countries, took 11 years to open its first $2 billion in private capital and only two years for the next $1 billion. From cash-on-delivery approaches to nascent equity and mezzanine financing by public sector agencies, a growing array of mechanisms have become available.
The way forward
Better data will lead to better development. Unlocking the full potential of an increasingly sophisticated development financing landscape requires better visibility and data quality across the entire range of flows, both public and private. Quality data both provide a basis for innovation and increase our understanding about the effectiveness of mixing certain types of flows—and too many gaps in the data still exist.
Despite advances in statistics through efforts such as the International Aid Transparency Initiative, no organized collection of the activity of development finance institutions exists. Currently, measurements for philanthropic flows at the country level contrast heavily with those at the global level. Take, for example, data presenting 2003–2012 U.S.-based foundation giving to Ghana as 0.6 percent of official development assistance10 while the Hudson Institute estimates $60 billion globally for a single year (2011). In addition, the commonly referenced dramatic growth of remittances has been recently called into question, with some experts chalking it up to an accounting change.11
To unleash the resources necessary to achieve our aspirations, data on financial resources and flows from all sectors and actors must be part of the post-2015 data revolution.
Strong domestic financial strategies and capabilities will pay dividends. Developing countries are eager to build their capacity for maximizing available financing options. According to the OECD, some projects have resulted in $170 in revenue for every $1 spent by donors to strengthen tax systems. Countries need assistance in providing their finance ministries with the capacity to independently develop financing strategies, and these strategies must optimize both the mix of financing resources and the ability to transition to increasingly sophisticated mechanisms as development occurs.
It is time we pay as much attention to a country’s financial development strategies as we do to its sector- or project-specific strategies.
Partnerships must evolve, innovate and measure. Examples like the New Alliance and Power Africa highlight the promise of largescale partnership platforms in helping us achieve outcomes at a significant scale. We will benefit from the continued development of partnership models that engage companies where commercial interests overlap with development needs, create policy environments that support growing private investment, identify market-based solutions that improve access and alleviate long-term poverty, and strengthen partner governments’ ability to increase private investment and economic activity.
The growing size and importance of non- Development Assistance Committee donors, both for public and private investment, begs for their inclusion in such partnerships. At the same time, we must hold ourselves to rigorous standards and measures of outcomes and cost-effectiveness. How do we know when the transaction costs of creating a collective effort, like the New Alliance, are worth it? How will we measure the effect of a program like Power Africa on the extreme poverty in partner countries?
Innovative financing frameworks for fragile states deserve special attention. The anticipated concentration of the extremely poor in fragile states poses a significant challenge to the providers of external public investment. Aid in these countries must become more nimble, integrated and balanced in its risk-taking.
We need a better understanding of how to best deploy highly concessional finance—which is what fragile states need, since they have the least ability to self-finance or access capital—to position countries on the path toward other sources of capital. Better integration of humanitarian and development resources, which USAID has pursued through its resilience agenda, is a promising start. We also must seek new forms of partnership that stimulate private investment in these environments and facilitate market-based solutions that impact the extremely poor.
These financing evolutions are not enough to achieve our ambitious post-2015 agenda. Trade, technology, control of illicit flows leaving countries, investments in research and innovation, and coherence among different policy tools all will play an important role in our success. At the same time, maximizing the expanding palette of financing choices and activities is critical to unlocking the scale of resources necessary to achieve our aspirations— financing an end for the first time in history to the indignities of extreme poverty, hunger, and child and maternal deaths. That would be truly revolutionary.
Tony Pipa is the international policy adviser to the administrator and deputy assistant to the administrator in USAID’s Bureau of Policy, Planning and Learning. The views expressed in this essay are his own and do not necessarily represent the views of the United States Agency for International Development or the United States Government.
1 Development Initiatives estimates that official development assistance only made up $149 billion of the roughly $2 trillion entering developing economies in 2011. Source: Development Initiatives, “Investments to End Poverty,” Chapter 7, pg. 126, http://devinit.org/wp-content/uploads/2013/09/Investments_to_End_Poverty..., accessed July 22, 2014.
2 Romilly Greenhill, “Who foots the bill after 2015? Why donors still need to take some responsibility for funding the post-2015 goals,” Overseas Development Institute, http://post2015.org/2013/03/25/whofoots-the-bill-after-2015-why-donors-s..., accessed July 22, 2014.
3 UNCTADstat, “Inward and outward foreign direct investment flows, annual, 1970-2012,” http://unctadstat.unctad.org/wds/TableViewer/tableView.aspx?ReportId=88
4 World Bank, “The State of the Poor: Where Are the Poor and Where Are They Poorest?” http://www.worldbank.org/content/dam/Worldbank/document/State_of_the_poo..., accessed July 22, 2014.
5 World Bank, “Global Monitoring Report 2013: Monitoring the MDGs,” http://econ.worldbank.org/WBSITE/EXTERNAL/EXTDEC/EXTDECPROSPECTS/0,,cont..., accessed July 22, 2014.
6 China, Russia Federation, Brazil, Turkey, India, Mexico, Indonesia, Argentina, Romania and Kazakhstan.
7 Given $263 billion in FDI inflows to the BRICs in 2012 and $702 billion in FDI inflows to all developing countries in the same year, that works out to a percentage of 37.4 percent, or roughly 40 percent. This data was collected from the following UN Conference on Trade and Development (UNCTAD) documents: “Global Investment Trends Monitor,” UNCTAD, http://unctad.org/en/PublicationsLibrary/webdiaeia2013d6_en.pdf, accessed July 21, 2014; UNCTADstat, “Inward and outward foreign direct investment flows, annual, 1970-2012,” http://unctadstat.unctad.org/TableViewer/tableView.aspx?ReportId=88, accessed July 21, 2014.
8 A notable exception is China, whose state-owned enterprises often play a key role in their development cooperation.
9 The Hudson Institute, “The Index of Global Philanthropy and Remittances: 2012,” Table 1, pg. 8, http://www.hudson.org/content/researchattachments/attachment/1015/2012in..., accessed July 28, 2014. 10 OECD working draft, “The New Development Finance Landscape: Developing Countries’ Perspective,” pg. 55, http://www.oecd.org/dac/aid-architecture/The%20New%20Development%20Finan..., accessed July 22, 2014.
11 Michael A. Clemens and David McKenzie, “Why Don’t Remittances Appear to Affect Growth,” GCDEV White Paper, http://www.cgdev.org/sites/default/files/why-dont-remittances-affect-gro..., accessed July 21, 2014.
Frontiers in Development
Section 4: Going Forward (Without Going Backward)



Comment
Make a general inquiry or suggest an improvement.