


Aaron Roesch
Poverty persists in diverse places, from small rural farms to sprawling urban slums. But perhaps the places that evoke the least hope are those that are violent, war-torn and disaster-stricken. Hotspots for conflict and instability, it seems, are hotbeds of poverty.
This nexus of fragility and extreme poverty is now central to the discourse on international development. The High-level Panel on the Post- 2015 Development Agenda, for instance, finds that, by 2015, more than half of the extreme poor will live in countries afflicted with conflict and violence. “To end extreme poverty and empower families to pursue better lives,” the panel writes, “requires peaceful and stable societies.”1

Yet this belies a more complicated history: Many countries struggling with fragility have reduced poverty—some substantially. To reverse pernicious trends and accelerate progress already underway across the range of “fragile states,” it is important to understand how countries have found success even amid fragile conditions, and to single out the obstacles that truly perpetuate poverty.
Correlation doesn’t mean causation
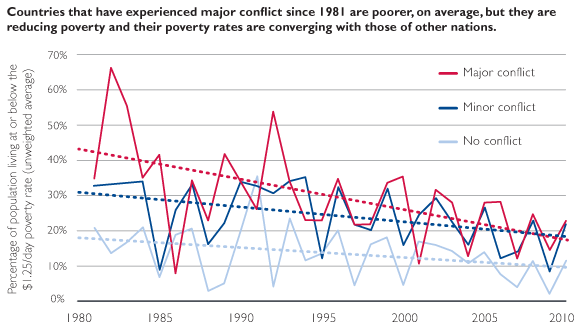
Two stylized facts about poverty and fragility are especially compelling. Poverty rates are 21 percentage points higher, on average, in countries that have experienced a major conflict since 1981.2 And, during the past two decades, the total number of extreme poor in non-fragile countries has fallen precipitously, while the number in fragile states has not; in fact, it has increased by nearly 50 million.3
That fragility and conflict exacerbate poverty and impede development seems self-evident. But correlation does not necessarily imply causation.
It is equally likely that poverty perpetuates fragility. Low incomes and slow economic growth are among the best-substantiated predictors of the onset of war.4 The poorest 10 percent of countries are 18 times more likely to experience conflict over a decade than the richest 10 percent.5 This relationship appears causal; A 1 percentage-point decline in gross domestic product increases the likelihood of war by 2 percentage points.6, 7
Causality can run both ways, of course, as a USAID discussion paper notes. A “fragility trap”—that is, “a self-perpetuating cycle of weak institutions, low investment, slow growth and repeated violence”—may prevent progress against poverty.8 Indeed, countries that experience a combination of economic shocks, income inequality, social fragmentation and poor governance see growth slow by 0.8 percent to 1.7 percent per year.9 In Rwanda, 20 percent of households moved into poverty following the country’s civil war and genocide—driven, in particular, by land loss and the destruction of property.10 During the Bosnian War, incomes plummeted more than 80 percent. Extreme poverty, virtually nonexistent before, surged to 11 percent.11
Other forms of fragility are also well established, such as the “resource curse.” A one-standard-deviation increase in primary exports slows growth by almost 0.5 percent annually, due largely to less trade openness,12 export-crippling “Dutch disease”13 and corruption.14
But some findings are counterintuitive. For instance, peace tends to be more durable when wars end by military victory rather than negotiated agreement.15 Post-conflict countries tend to have more robust political participation.16 And, despite the destruction of war, many countries rebound rapidly.17 In Bosnia, for example, poverty rates returned to pre-war levels within just six years.18 In the wake of violence in Rwanda, nearly as many households—18 percent—moved out of poverty as moved in.19
So the picture is muddled—even where the data seem indisputable.
For example, the 21-point disparity between the poverty rates of violent and peaceful countries actually represents an extrapolation of conflict’s effect on the average country, rather than a direct estimate of countries’ experiences. In fact, countries that endured major conflict in the last three decades started out much poorer, by about 15 percentage points. Since then, though, they have reduced poverty. Their average extreme poverty rates actually declined faster than other countries’—so much so that, today, they are on par with countries that experienced only minor conflict.20
Likewise, the stagnant number of extreme poor in fragile states suggests little recent progress, if not regression. But this calculation applies the latest classification of fragile states retroactively to 1990. Doesn’t this “beg the question”? Clearly, countries that are fragile today haven’t performed well recently. A more interesting look would be at nations considered fragile in 1990. Standard fragility measures didn’t exist in 1990; however, even comparing the Organization for Economic Cooperation and Development (OECD) fragile states lists for 2008 and 2014 is revealing. Of 47 states considered fragile in 2008, 12 have graduated,21 and they have continued to perform well since—but they were also on better trajectories much earlier and, in fact, started out 53 percent wealthier even in 1990.22

| Definition | Count | # LICs | % of LICs | Example | |
|---|---|---|---|---|---|
| 1 | Poor governance | 30 | 16 | 44% | World Bank Country Policy and Institutional Assessment |
| 2 | Conflict and instability | 34 | 22 | 61% | Fund for Peace Fragile States Index |
| 3 | Poor governance or conflict (the union of #1 and #2) | 51 | 28 | 78% | OECD Fragile States list |
| 4 | Either severe conflict or else moderate conflict and poor governance (roughly the intersection of #1 and #2) | 19 | 7 | 19% | USAID’s 2004–2006 approach |
| 5 | Illegitimate and ineffective institutions | 33 | 20 | 56% | USAID Fragile States Strategy |
So, even amid fragility, countries have grown—and grown inclusively. This implies that resolving fragility is not a precondition for reducing poverty. In fact, of the 10 countries that reduced extreme poverty the most since 1981, only one did not experience a conflict in that period: Bhutan.23 Cambodia, for example, despite 18 straight years of fighting with the Khmer Rouge, slashed poverty by 59 percentage points. Indonesia fought multiple wars, including with now-independent Timor-Leste—both saw declines of nearly 50 percentage points.24
What is fragility—and is it meaningful for thinking about poverty?
So, what does “fragility” mean, if some countries are able to grow and overcome it, while others seem mired in perpetual instability?
In fact, fragility is an ill-defined term. USAID Senior Economist Mike Crosswell identifies five distinct characterizations of fragile states.25
Differing characterizations pose one immediate problem: inconsistent counts of fragile states. USAID’s mid-2000s approach, for example, identifies fewer than 20 fragile states, while the OECD finds more than 50. Under the narrower definition, fewer than 20 percent of low-income countries count as fragile; under the broader definition, nearly 80 percent do. Only nine countries meet all five criteria.26
A second problem is that, while levels of fragility correlate strongly with levels of poverty, changes in fragility tend to correlate poorly with changes in poverty.

This complicates the narrative that mitigating fragility leads to poverty reduction.27, 28
Third, for measures that do produce a correlation, such as USAID’s current definition, this seems to be only because the metric subsumes one of poverty itself. The very notion of fragility thus becomes tautological.
For example, when USAID’s fragility measure is decomposed into its two components—legitimacy and effectiveness—it is clear that the effectiveness indicators substantiate the correlation. Yet many of these are direct or proxy measures of poverty itself: the $2-a-day poverty rate, youth literacy, infant mortality, children’s immunizations, access to water and sanitation.29 At the same time, improvements in legitimacy are, on their own, poor predictors of declines in poverty.30
When disaggregated, components of fragility have heterogeneous effects on poverty.1
| Effect on: | Poverty rate | Avg. consumption (log) | GDP per capita (log) | 5yr-lagged GDP per capita (log) | |
|---|---|---|---|---|---|
|
VIOLENT
|
Active major conflict | 0.044 | -0.141 | -0.123 | -0.032 |
| Per UCDP-PRIO2 | (0.94) | (1.32) | (1.73) | (0.56) | |
| Active minor conflict | 0.042 | -0.070 | -0.073 | 0.014 | |
| Per UCDP-PRIO3 | (1.61) | (0.79) | (1.13) | (0.22) | |
| Post-conflict | 0.037 | -0.120 | -0.102 | -0.095 | |
| Per UCDP-PRIO, w/i 10yrs4 | (2.14)* | (1.78) | (3.06)** | (2.70)** | |
| High violent crime | 0.001 | -0.015 | 0.094 | 0.110 | |
| Homicide rate >0.02%5 | (0.12) | (0.26) | (2.01)* | (2.57)* | |
|
VOLATILE
|
Recent regime change | 0.000 | -0.300 | -0.284 | -0.186 |
| Per Polity IV, w/i 10yrs6 | (1.75e+13)** | (9.92e+14)** | (1.71e+14)** | (7.62e+14)** | |
| Resource wealth | -0.023 | 0.057 | 0.084 | 0.062 | |
| >20% resource rents7 | (1.17) | (1.27) | (2.12)* | (2.07)* | |
|
UNFREE
|
Anocracy | -0.020 | 0.061 | -0.107 | -0.148 |
| Per Polity IV8 | (0.82) | (0.49) | (0.93) | (1.58) | |
| Autocracy | 0.010 | 0.052 | -0.259 | -0.198 | |
| Per Polity IV9 | (0.23) | (0.42) | (1.35) | (1.87) | |
| _cons |
0.126 (6.10)** |
5.197 (58.75)** |
9.224 (111.07)** |
9.112 (133.48)** |
|
| R2 | 0.05 | 0.04 | 0.05 | 0.06 | |
| N | 663 | 663 | 1,671 | 1,654 | |
| * p<0.05; ** p<0.01 | |||||
|
1 This analysis of four dependent variables uses a fixed-effects regression, holding all place- and time-invariant characteristics steady, with binary “dummy” variables for eight fragility proxies. 2 LThemnér, “UCDP/PRIO Armed Conflict Dataset Codebook,” Uppsala Conflict Data Program and International Peace Research Institute, Oslo: 2014. 3 Themnér, 2014. 4 H Strand and M Dahl, “Defining Conflict-Affected Countries,” paper commissioned by UNESCO for the EFA Global Monitoring Report 2011, The hidden crisis: Armed conflict and education, 2010. 5 E Bisogno et al., “Global Study on Homicide 2013: Trends, Contexts, Data,” U.N. Office on Drugs and Crime, Vienna: 2013. 6 MG Marshall, TR Gurr and K Jaggers, “Polity IV Project: Political Regime Characteristics and Transitions, 1800-2013: Dataset Users’ Manual,” Center for Systemic Peace, Vienna, VA: 2013. 7 P Collier and A Hoeffler, “Democracy and Resource Rents,” Oxford University, Oxford: 2005. 8 Marshall, Gurr and Jaggers, 2013. 9 Marshall, Gurr and Jaggers, 2013. |
|||||
Of course, all else equal, poor states are more fragile. But we should be concerned about endogeneity31—that we circularly define fragility using poverty. To understand the constraints to poverty reduction, we need a measure for fragility that is insulated from one of poverty.
A few ideas for repurposing “fragility”
A more useful typology would disaggregate “fragility” and parse its components’ varied effects on poverty. For instance, post-conflict countries see a 3.7-point higher extreme poverty rate when controlling for several other types of fragility and for all place- and time-invariant characteristics. Likewise, a recent regime interregnum lowers mean consumption by 30 percent. Yet other manifestations of fragility—including active conflict—show mixed or insignificant effects on poverty.32
Although insufficient data from the world’s most unstable places may skew our findings, we should consider a couple of other possibilities that may help explain the puzzling findings on conflict and poverty: Localized conflicts, while devastating for affected communities, may not appreciably hinder poverty reduction nationwide; and some wars, while destructive, may usher in better, more beneficent governments—complicating the long-run implications.
Uganda offers an illustrative example. Decades of war exacted a catastrophic toll; yet, incongruously, few countries have been more successful in reducing poverty. Uganda’s 35-percentage-point decline since 1990 is the sixth-steepest in Africa.33, 34
In Uganda’s north, where the Lord’s Resistance Army roamed unchecked for years, many people lost everything—cattle, assets, homes.35 Thousands of former child soldiers, who missed out on education, today earn 33 percent less than their peers.36
Yet this violence, however brutal, was largely relegated to three districts far from the capital. We don’t know the counterfactual, but this localized fighting does not seem to have much impeded sustained national growth.37

Moreover, conflict helped galvanize Uganda’s turnaround in the first place. In the 1980s, President Yoweri Museveni, then a rebel commander, mobilized an insurgency through “resistance councils.” In peacetime, these structures morphed into local councils, an early and continued lynchpin of Uganda’s decentralized governance.38, 39
We need to disentangle these causes, correlates and consequences. Fragility analyses, however, often provide an undifferentiated list of conditions. For example, the two pilot fragility assessments for the New Deal for Fragile States—for Sierra Leone and South Sudan—are clear, substantive and insightful. Yet each lists dozens of challenges; South Sudan’s identifies 62 discrete “priority” actions.40 In contrast, the practice of differential diagnosis, popularized for identifying binding constraints to economic growth, may provide a more practicable model.41, 42
At the same time, let’s not “take refuge in complexity.”43 We should consider each country’s unique circumstances, of course. Deep contextual understanding is essential. But if we hope to scale and replicate transformative solutions, if we want to build partnerships across countries, we also need sound comparative analysis.
For instance, can we identify reasonable country “cohorts” among fragile states, homing in on particular conditions—shared across countries—that pose the greatest impediments to poverty reduction? And what novel solutions have already been tested within these groups? For example, Chile’s countercyclical fiscal rules, informed by independent experts, help smooth the effects of volatile copper prices, and Botswana’s professionally managed Pula Fund, which is invested in foreign securities, offsets depleted diamond stocks and manages price fluctuations.44 Are these replicable models for other resource-rich countries? Disaggregation does not mean atomization—there’s value in spotting similarities.
Most importantly, we should be wary of the easy narrative that some states are ensnared in fragility and avoid the conceit that—if we can only free them—the end of poverty lies just ahead.
Rather, we should focus on fixing what’s fixable: building human and institutional capacity, scaling and replicating creative solutions and prioritizing the reforms and investments most likely to unlock sustained, inclusive growth. We should recognize that weak or unscrupulous leadership is hard to right and that the poorest countries are coming from much further behind.
Ending poverty—extreme or otherwise—demands that we take the long view. The path may be uneven and circuitous, but we should take heart in the extraordinary progress to date—even if, in some places, it’s far from enough.
Aaron Roesch is a policy analyst in USAID’s Bureau of Policy, Planning and Learning. The views expressed in this essay are his own and do not necessarily represent the views of the United States Agency for International Development or the United States Government.
1 United Nations High-level Panel, “A New Global Partnership: Eradicate Poverty and Transform Economies through Sustainable Development,” New York: 2013.
2 S Cliffe and N Roberts, “World Development Report 2011: Conflict, Security, and Development,” World Bank, Washington: 2011.
3 L Chandy, N Ledlie and V Penciakova, “The Final Countdown: Prospects for Ending Extreme Poverty by 2030,” Brookings Institution, Washington: 2013; and own calculations, based on PovcalNet; K Kotoglu, DB Ray, S Jones, “Monitoring Resource Flows to Fragile States 2007,” OECD-DAC Fragile States Group, Paris: 2008; and E Letouzé, J Profos and SL Cramer, “Fragile States 2014: Domestic Revenue Mobilization in Fragile States,” OCED-DAC International Network on Conflict and Fragility, Paris: 2014.
4 H Hegre and N Sambanis, “Sensitivity Analysis and Empirical Results on Civil War Onset,” Journal of Conflict Resolution 50:4, 2006; C Blattman and E Miguel, “Civil War,” Journal of Economic Literature 48:1, 2010.
5 JD Fearon and DD Laitin, “Ethnicity, Insurgency, and Civil War,” American Political Science Review 97:1, 2003; P Collier and A Hoeffler, “Greed and Grievance in Civil War,” Oxford Economic Papers 56, 2004
6 The causal direction is elucidated by an instrumental variable, annual rainfall. The authors argue that a deficiency of rain dampens growth and makes conflict more likely.
7 E Miguel, S Satyanath and E Sergenti, “Economic Shocks and Civil Conflict: An Instrumental Variables Approach,” Journal of Political Economy 112:4, 2004.
8 USAID, “Ending Extreme Poverty in Fragile States,” Washington: 2014.
9 D Rodrik, “Where Did All the Growth Go? External Shocks, Social Conflict, and Growth Collapses,” Journal of Economic Growth 4, 1999.
10 P Justino and P Verwimp, “Poverty Dynamics, Violent Conflict and Convergence in Rwanda,” MICROCON Research Working Paper 4, Brighton: 2008.
11 D Djipa, M Muzur and PF Lytle, “Bosnia and Herzegovina: War-Torn Lives,” in D Narayan and P Petesch eds., Voices of the Poor: From Many Lands, World Bank, New York: Oxford University Press, 2002.
12 JD Sachs and AM Warner, “Natural Resource Abundance and Economic Growth,” NBER Working Paper 5398, Cambridge: 1995.
13 Dutch disease is a phenomenon triggered by a large inflow of foreign currency (often from commodity exports or even foreign aid), which leads to local currency appreciation and then decreased competitiveness of other exports. See http://lexicon.ft.com/Term?term=dutch-disease
14 X Sala-i-Martin and A Subramanian, “Addressing the Natural Resource Curse: An Illustration from Nigeria,” NBER Working Paper Series 9804, Cambridge: 2003.
15 MD Toft, Securing the Peace: The Durable Settlement of Civil Wars, Princeton: Princeton University Press, 2009.
16 J Bellow and E Miguel, “War and the Local Collective Action in Sierra Leone,” Journal of Public Economics 93:11-12, 2009; C Blattman, “From Violence to Voting: War and Political Participation in Uganda,” American Political Science Review 103:2, 2009.
17 E Miguel and G Roland, “The Long Run Impact of Bombing in Vietnam,” BREAD Working Paper 111, 2006.
18 Own calculations, based on PovcalNet.
19 Bellow and Miguel, 2009.
20 Own calculations, based on PovcalNet; L Themnér and P Wallensteen, “Armed Conflict, 1946-2012,” Journal of Peace Research 50:4, 2013; and NP Gleditsch, P Wallensteen, M Eriksson, M Sollenberg and H Strand, “Armed Conflict 1946-2001: A New Dataset,” Journal of Peace Research 39:5, 2002.
21 The 12 “graduates” between 2008 and 2014 are Cambodia, Djibouti, Equatorial Guinea, The Gambia, Laos, Papua New Guinea, Rwanda, São Tomé and Príncipe, Tajikistan, Tonga, Uzbekistan and Vanuatu. Another 16 nations became newly fragile.
22 Own calculations, based on PovcalNet; OECD-DAC Fragile States 2007; and OECD-DAC Fragile States 2014.
23 The top 10 by total percentage-point reduction between 1981 and 2010 are, in order: Bhutan, China, Vietnam, Pakistan, Cambodia, Nepal, Indonesia, Laos, Tajikistan, Timor-Leste. Five (Pakistan, Cambodia, Nepal, Indonesia and Tajikistan) experienced major conflicts.
24 Own calculations, based on PovcalNet and Armed Conflict, 1946-2012.
25 M Crosswell, “Identifying Fragile States: Approaches and Issues,” USAID Senior Economist #18, Washington: 2013.
26 Own calculations, based on Crosswell; World Bank, “Harmonized List of Fragile States FY14,” 2014; Fund for Peace, “Failed States Index 2013,” 2013; and OECD-DAC Fragile States 2014; USAID and ARD Consortium, “Measuring Fragility: Indicators and Methods for Rating State Performance,” Washington: 2005.
27 The lack of statistically significant correlation is due, in part, to limited time series in fragility indices, with publicly available CPIA and FSI scores dating only to 2005.
28 Own calculations, based on PovcalNet; USAID and ARD Consortium, “Measuring Fragility: Indicators and Methods for Rating State Performance,” 2005; World Bank, “World Development Indicators,” 2014; Failed States Index 2013.
29 USAID and ARD Consortium, “Measuring Fragility: Indicators and Methods for Rating State Performance,” 2005.
30 Own calculations, based on PovcalNet and USAID and ARD Consortium, “Measuring Fragility: Indicators and Methods for Rating State Performance,” 2005.
31 Endogeneity is a correlation between a statistical model’s independent variable and the error term. There are various causes; one is simultaneity, when the independent and dependent variables are circularly causal. For instance, a model to predict consumer demand in a competitive market based on price may be endogenous because producers would adjust prices based on demand.
32 Own calculations, based on PovcalNet; World Development Indicators; MG Marshall, TR Gurr and K Jaggers, “Polity IV Project: Political Regime Characteristics and Transitions, 1800–2012,” Center for Systemic Peace, Vienna, VA: 2013; Armed Conflict, 1946-2012; Armed Conflict 1946-2001: A New Dataset,” Journal of Peace Research 39:5, 2002.
33 Undoubtedly, governance in Uganda raises other concerns, such as “no party democracy” and a venomous anti-LGBT law. But on extreme poverty, few African countries have done better.
34 Own calculations, based on PovcalNet, World Development Indicators; Polity IV; MEPV.
35 Blattman and Miguel, 2010.
36 C Blattman and J Annan, “The Consequences of Child Soldiering,” The Review of Economics and Statistics 92:4, 2010.
37 World Bank, “Poverty Trends in Uganda: Who Gained and Who Was Left Behind?” Inclusive Growth Policy Note, Washington: 2012.
38 For example, the resistance-turned-local councils helped Museveni’s government hold 86 listening seminars, develop educational materials for all 813 sub-counties and receive and review 25,547 memoranda from groups and individuals in the effort to draft a constitution.
39 JM Weinstein, “Autonomous Recovery and International Intervention in Comparative Perspective,” Center for Global Development Working Paper 57, 2005.
40 Government of the Republic of Sierra Leone, “Fragility Assessment: Republic of Sierra Leone,” 2013; Government of the Republic of South Sudan, “Fragility Assessment: Republic of South Sudan,” 2012.
41 The approach, often called “constraints analysis” or “growth diagnostics,” was pioneered by Ricardo Hausmann, Dani Rodrik and Andrés Velasco. The intent is to identify the most binding constraints to an economy’s growth, and thus, the handful of policy interventions that will release the most potential.
42 R Hausmann, D Rodrik and A Velasco, “Growth Diagnostics,” Harvard Kennedy School, Cambridge: 2005.
43 R Zeckhauser, “Analytic Frameworks for Policy” (lecture), Harvard Kennedy School of Government, 2011.
44 J Frankel, “The Natural Resource Curse: A Survey of Diagnoses and Some Prescriptions,” in R Arezki, C Patillo, M Quintyn and Z Min (eds.), Commodity Price Volatility and Inclusive Growth in Low-Income Countries, International Monetary Fund, Washington: 2012.

Comment
Make a general inquiry or suggest an improvement.