


One of the greatest development challenges of the 21st century is meeting both current growth rates in energy demand around the world and the future needs of the 9 billion people projected to share the planet by 2050.
Energy efficiency is a powerful strategy that developing countries can use to secure their energy future while continuing along a prosperous and sustainable development path. Efficiency is a proven approach to reducing energy consumption while bolstering economies and creating jobs in North America and Europe, and the potential gains in the developing world may be even greater.
The Energy Efficiency Opportunity
One of the main opportunities for energy efficiency in emerging economies is in the rapid growth of new construction and infrastructure. In the developed world, growth rates are lower and the built environment is older, creating fewer and more expensive efficiency opportunities. However, the growth in many developing countries provides an opportunity for efficiency to be designed into buildings and other types of infrastructure, which avoids unnecessary and expensive energy consumption from the beginning and the need for costly retrofits in the future.
From 2010–2020, developing countries are projected to install fifty percent or more of their total 2020 building stock. These buildings and plants will use energy for decades to come, so design decisions made today have a large impact on future energy demand. Each new residence, commercial building or industrial plant is an opportunity for a long-term energy efficiency investment and for savings. Designing new buildings to be more efficient (e.g. window, wall, appliance and lighting installations, as well as planning for sunlight exposure and shade) is one way to dramatically reduce overall energy demand growth trajectories.
Over the next 12 years, developing countries could use energy efficiency policies and programs to slow their energy demand growth by more than half while boosting their GDP. In Serbia and Montenegro, for instance, where energy intensity is much higher than in the rest of Europe, energy efficiency improvements could boost GDP growth by 5 to 7 percent. No other single approach could help achieve this kind of increase in growth at the same rate.
In Kosovo, where GDP growth trails other countries in Southeastern Europe, policymakers and economists alike agree that one of the most pervasive impediments to private sector growth is the lack of consistent power supply. Each year, it is estimated that Kosovo businesses realize 359 million Euros in losses due to unreliable power, which represents 7.7 percent of Kosovo’s 2011 GDP. At the ground level, the average firm operating in Kosovo will incur additional costs representing 6.24 percent of the firm’s average turnover, 11.36 percent of total expenses, and 13.86 percent of profits due to unreliable power supply, with micro and small enterprises being disproportionately impacted. This indicates a significant opportunity for energy efficiency improvements to reduce the cost of doing business in Kosovo.
Linkages Between Energy Efficiency, Jobs and Consumer Welfare
Energy efficiency stimulates economic growth and creates jobs in a variety of ways. In the Kosovo case study cited above, if power supply was more reliable, 38 percent of the 553 businesses surveyed reported they would expand their service and product offerings, 34 percent indicated they would hire more staff and 28 percent reported their businesses would stay open longer. Energy efficiency investments in infrastructure and appliances could help unlock this untapped economic potential.
While most economic investments create a ripple effect through the economy, energy efficiency creates more jobs per dollar invested than traditional energy supply investments. Efficiency also creates more jobs in the local economy, whereas energy supply jobs and investment dollars often flow outside the country into global energy markets. While job growth projections associated with building new power generation are often impressive, they typically do not match the job growth that would result from investing an equivalent amount in energy efficiency. Policy can be an effective mechanism to encourage efficiency investments, drive job creation and increase the benefits flowing into the local economy.
Energy efficiency creates three types of jobs, each representing an expanded level of economic impact:
Three Types of Jobs Created by Energy Efficiency
- Direct Jobs
- Direct jobs are created as an immediate result of an energy efficiency investment. For example, jobs are created when workers are deployed to install and maintain energy-efficient technology.
- Indirect Jobs
- Indirect jobs are created in the supply and service chains that are directly impacted by an energy efficiency investment. Examples of indirect jobs include those created at facilities that supply building materials or manufacture or distribute energy-efficient products. Even when energy-efficient products are produced outside the country, there is still job growth potential along the supply chain as goods move from manufacturer to distributor to retailer to end user.
- Induced Jobs
- Induced jobs are created through the spending of income earned by workers hired into new direct and indirect job positions on goods and services in the local economy. Jobs are also created when money saved on energy bills is spent on other priorities such as education, food, medicine or non-essential items and services. Economists regularly note such “cross-elasticity” effects when energy prices fall and retail sales rise accordingly.
It is also important to consider the impact of energy efficiency investments over time. In the short term, money spent on energy efficiency improvements drives direct, indirect and induced job creation in labor-intensive industries like construction, contracting, maintenance and engineering. In the long-term, money saved through reduced energy bills will be recirculated by individuals and reinvested by businesses. This reinjection of capital will have an economic multiplier effect, just like spending by new workers hired into direct and indirect jobs. In fact, this is where the majority of the job creation occurs as a result of energy efficiency programs.
Energy Efficiency and Job Growth Example
In a suburb of Cape Town, South Africa, the Kuyasa Low-Income Energy Efficiency Housing Project demonstrated that between 1999 and 2010, investments in energy efficiency not only reduced energy consumption by 155 million kWh and CO2 emissions by 135,187 tons but that efficiency also led to the establishment of an industry which spanned solar water heaters, ceiling insulation and compact fluorescent lamps (CFLs). The Kuyasa project, which was budgeted at US $4.67 million and eventually registered with the United Nations Framework Convention on Climate Change (UNFCCC) as the first Clean Development Mechanism (CDM) project in South Africa, demonstrated how energy efficiency interventions in low-income communities could be successfully implemented to help alleviate complex problems such as poverty, unemployment and lack of sustainability.
The Kuyasa project included the installation of a series of residential retrofits for low-income housing units to improve thermal performance, provide energy-efficient lighting and improve water heating efficiency through solar water heaters. To improve thermal efficiency, the project team installed insulated ceilings. Each housing unit included in the project received two CFL bulbs, a solar water heater with a collector area spanning 1.4 square meters (15.07 square feet), and a hot water storage tank of 100 liters (22.7 gallons). In support of the local economy, South African contractors were invited to apply to participate in the program. These contractors, along with other local residents, received training on how to install the insulated ceilings, solar water heaters and CFLs. Although the project covered the majority of the equipment and installation costs, participating households made small monthly payments which instilled a senof ownership in the upgrades.
By 2010, energy efficiency retrofits for 2,309 houses in Kuyasa had been completed, and the project had created 87 local employment opportunities. Further evaluations suggest that nearly half of Kuyasa residents who received technical skills training during this project now have full-time jobs or business opportunities outside the community. In addition, all residents who participated in the program reported cost savings and a sustained increase in household income of USD $21 per month during the winter and electricity savings of USD $7 per month.
Energy Efficiency and Energy Supply Example
Utilities (in addition to their customers) benefit from implementing energy efficiency programs in a number of ways. For example, investments in energy efficiency allow utilities to avoid the additional marginal costs of producing more energy, including developing generation capacity and building further transmission and distribution assets. Energy efficiency programs also reduce the cost of environmental compliance and mitigate demand reduction-induced price effects. Typically, energy efficiency is the least costly resource available to utilities, and energy efficiency can be deployed as an alternative to constructing new power plants or deferring transmission and distribution investments.
According to the U.S. Energy Information Administration (EIA), the cost of constructing new power plants has been increasing. Higher capital and other costs mean that energy efficiency programs which reduce peak demand and improve grid reliability can yield significant savings (or avoided costs) for utility systems. For example, across 36 U.S. companies reviewed in a study cited by an ACEEE report (PDF 1.1MB), some companies saved up to $171/kW-year with an average avoided transmission and distribution costs of $48.37 over the course of three years.
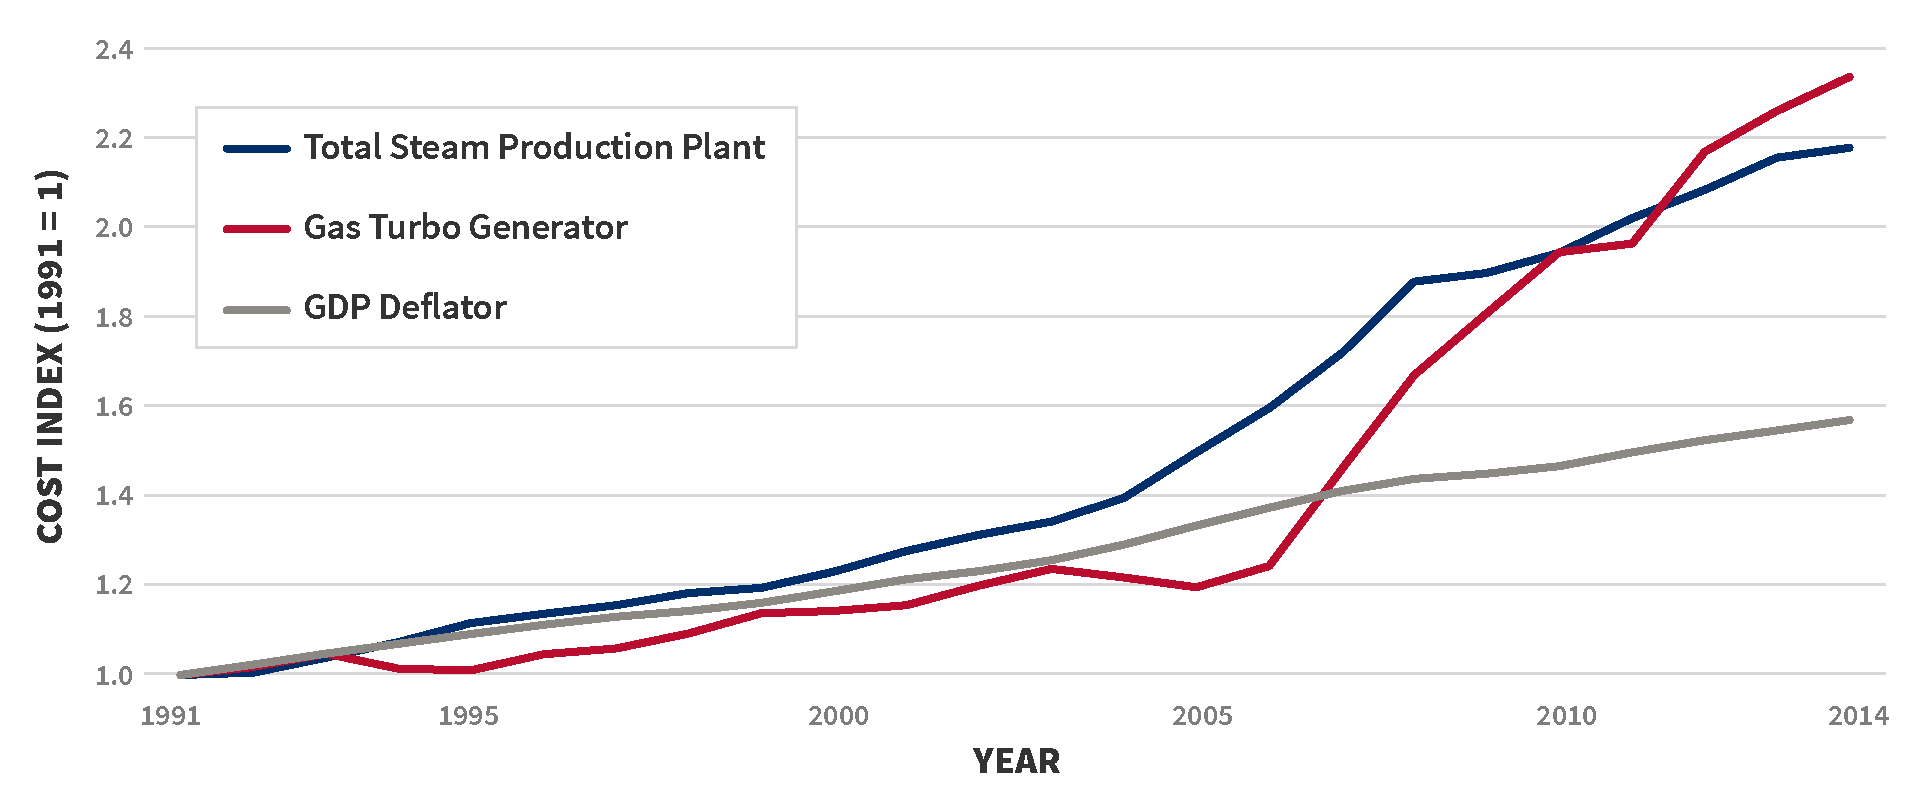
United States Bureau of Economic Analysis (2015). Current and Real GDP.
Comment
Make a general inquiry or suggest an improvement.