Home » What We Do » Agriculture and Food Security » Food Assistance » Country Fact Sheets » Food Assistance Fact Sheet - Mozambique
- What We Do
- Agriculture and Food Security
- Democracy, Human Rights and Governance
- Economic Growth and Trade
- Education
- Ending Extreme Poverty
- Environment and Global Climate Change
- Gender Equality and Women's Empowerment
- Global Health
- Water and Sanitation
- Working in Crises and Conflict
- U.S. Global Development Lab
October 4, 2016
Food Security Situation
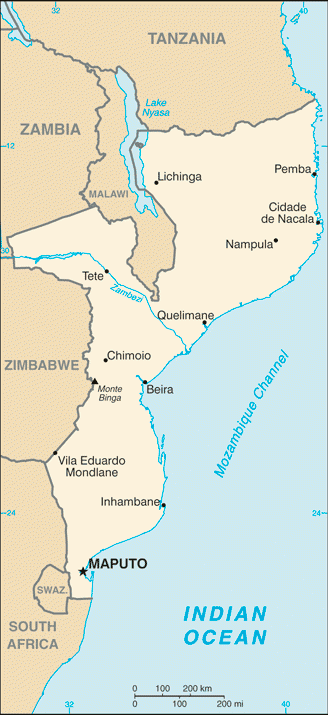
CIA World Factbook
- Based on a new report released by the Mozambique Technical Secretariat for Food Security and Nutrition (SETSAN), an estimated 2.3 million people are facing acute food insecurity and are in need of humanitarian assistance in Mozambique. Household cereal reserves are non-existent for most, and less than 10 percent of households produced some form of cereal harvest. Global acute malnutrition rates in Sofala and Tete provinces are above 15 percent, and it is estimated that nearly 100,000 children will suffer from acute malnutrition over the next six months.
- In addition to being prone to severe cases of food insecurity, Mozambique is faced with a high rate of HIV infection, with approximately 11.5 percent of individuals affected.
- Over 80 percent of Mozambique’s population lives in rural areas, making small-scale agriculture an important source of income for most rural women. Smallholder farmers represent most of the national agricultural production. These populations are especially vulnerable to food insecurity exacerbated by the El Niño induced drought.
- According to FEWS NET, poor rainfall and severe drought due to El Niño during the 2015/2016 season have led to IPC 3 (Crisis) food security outcomes in the southern and central regions.
Food Assistance Programs
-
The Office of Food for Peace (FFP) is partnering with the UN World Food Program (WFP), World Vision and UNICEF to provide $22 million in emergency food and nutrition assistance to drought-affected populations in Mozambique. Through this assistance, FFP is supporting general food distribution to meet immediate needs, and food for asset activities to protect livelihoods, strengthen community assets and support agricultural recovery. FFP is also supporting UNICEF to provide Ready-to-Use Therapeutic Foods (RUTF) to treat severe acute malnutrition in children.
Food for Peace Contributions
Total Contributions:
| U.S. Dollars | Metric Tons | |
|---|---|---|
| Fiscal Year 2016 | $22.0 million | 18,074 MT |
| Fiscal Year 2015 | $2.0 million | 1,867 MT |
| Fiscal Year 2014 | $1.5 million | 1,777 MT |
| Fiscal Year 2013 | $1.7 million | 1,960 MT |
| Fiscal Year 2012 | $17.8 million | 39,120 MT |
Fiscal Year 2013 Contribution Breakdown:
| U.S. Dollars | Metric Tons | |
|---|---|---|
| Title II Development | $4.0 millon | 3,424 MT |
| Title II Emergency | $18.0 million | 14,650 MT |
| Emergency Food Security Program (EFSP) |
Note: EFSP: Emergency Food Security Program; FEWS NET: Famine Early Warning Systems Network;


Comment
Make a general inquiry or suggest an improvement.